Agility Logistics Parks
Leading private owner and operator of warehousing and light-industrial parks across Middle East, Africa, and South Asia.
Visit website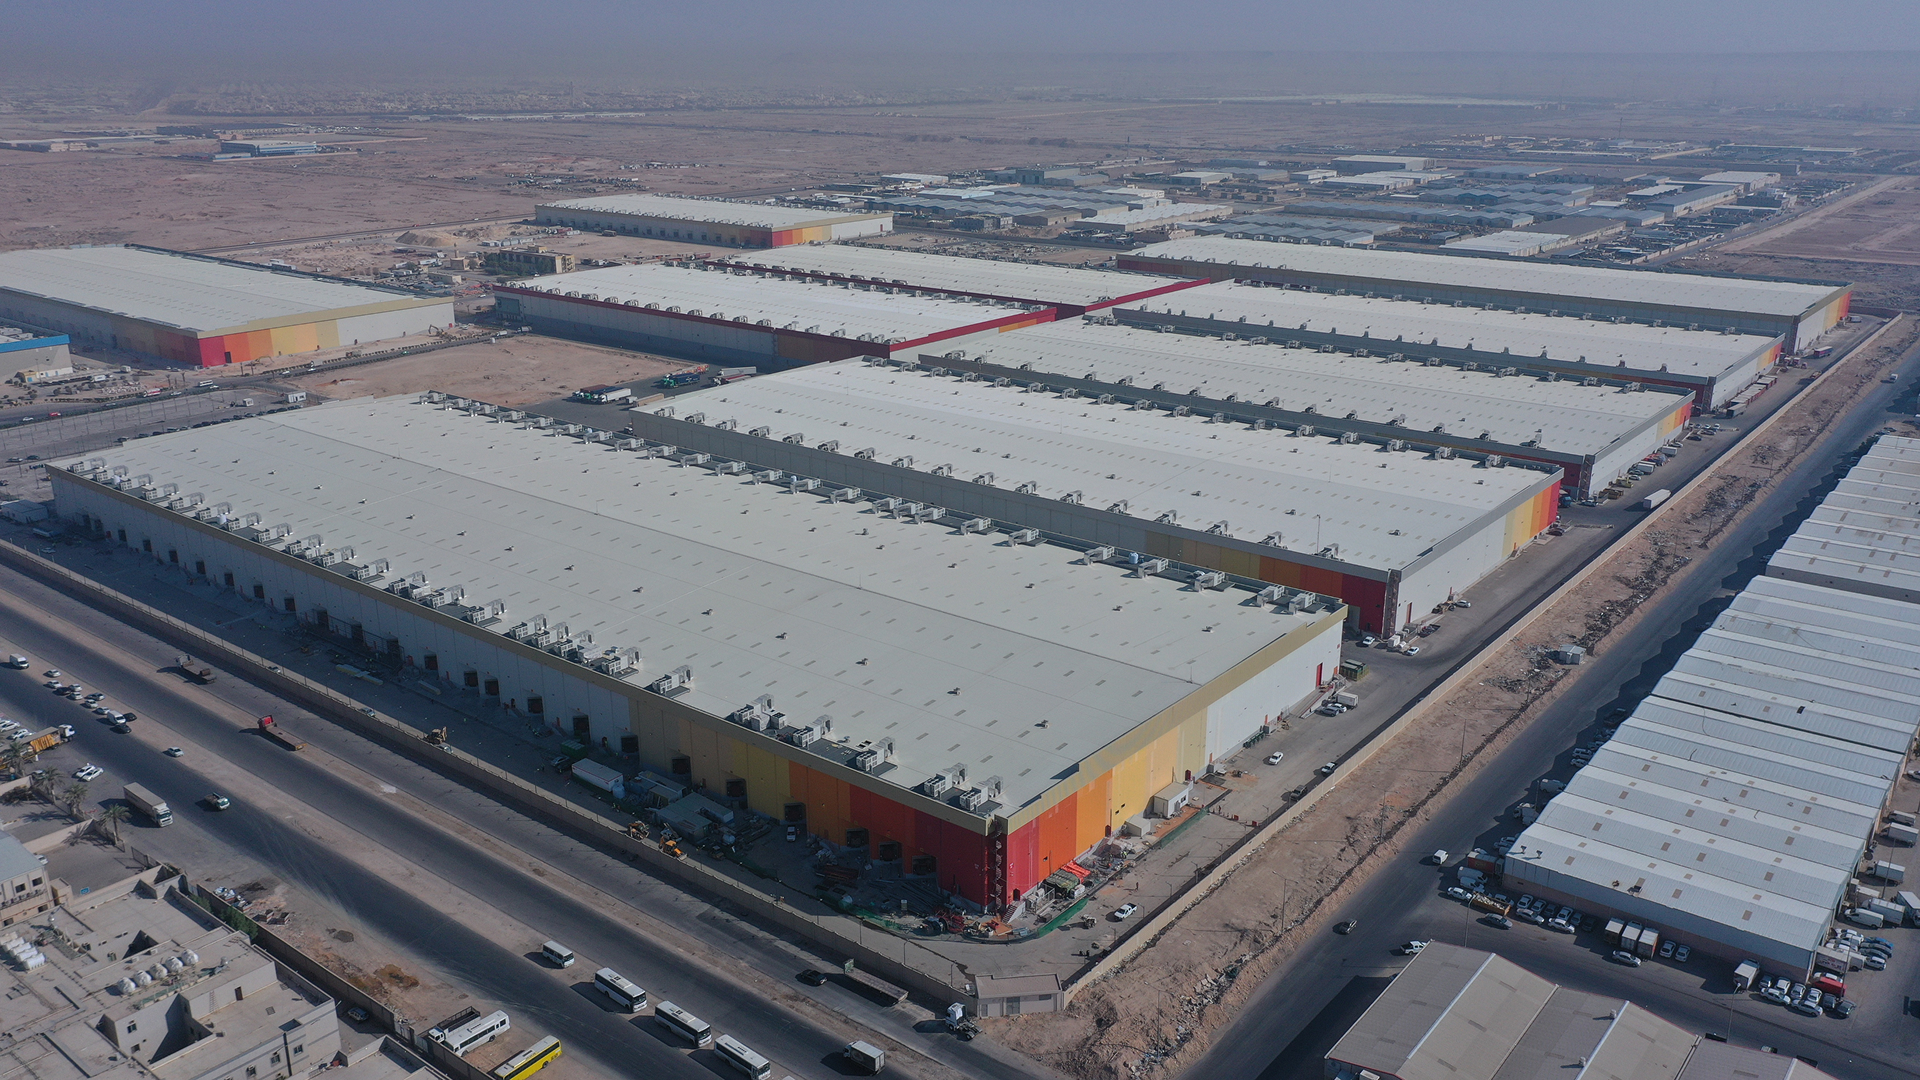
Middle East & Africa Footprint
SQM Industrial Land
6.1M
SQM Warehousing
1.1M
Countries of Operations
8
Service Offering
Agility Logistics Parks provides ready-built warehouses, built-to-suit facilities, and 24/7 management services.
Ready-Built Warehouses and Light Industrial Units
Built-to-Suit Facilities
Open Yards
24/7 Facilities Management Services
Diversified Clients
Agility Logistics Parks serves a wide range of industries including retail, manufacturing, and logistics.